Exploring Zeta Function Visualizations
(GMT)
Grant Sanderson (3Blue1Brown)
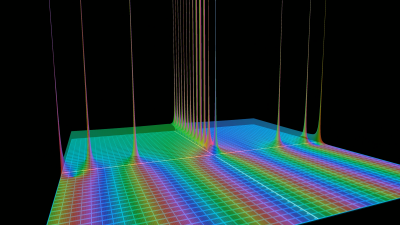
We’ll start from a very straightforward visual of the Riemann Zeta function as a sum, and proceed to alternate ways to interpret it so that we can make sense of it in the region of divergence. From there, we can play around with how it interplays with the sum over (1/k)(1/p^{ks}) on those same spots, where zeta zeros look like poles.