The Institut Henri Poincaré (in Paris) is currently hosting the trimester program "Illustration as a Mathematical Research Technique." This month, the seminar will live stream from a modified "Show and Ask" session that will take place at IHP.
The Illustrating Math Virtual Seminar meets the second Friday of each month. Talks cover a wide range of topics related to successes and challenges of mathematical illustration, from cutting edge theoretical research to explorations of intersections between mathematics and the arts. The seminar showcases innovative ways to communicate and explore deep mathematical ideas.
The monthly seminar is held on Zoom. Each meeting opens with two five-minute ‘show and ask’ style presentations (volunteer here to give one), which are followed by the main feature, a 40 minute invited colloquium talk. Immediately afterwards, participants (and speakers) are invited to gather informally on the illustrating math discord server for further social interaction.

The Institut Henri Poincaré (in Paris) is currently hosting the trimester program "Illustration as a Mathematical Research Technique." This month, the seminar will live stream from a modified "Show and Ask" session that will take place at IHP.
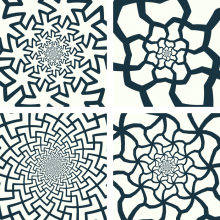
In the course of his explorations of the visual representation of infinity, M.C. Escher created several prints in which tessellated figures spiral inward towards a limit in the centre of the design. I present a pleasingly simple way to think about these spiral tilings, based on the exponential function in the complex plane, and connect it to a few other related ideas in mathematical art.
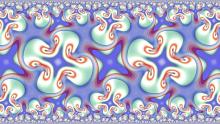
We present efficient computational methods for generating, visualizing, and interactively exploring symmetric patterns in Euclidean, spherical, hyperbolic, and inversive geometries. The algorithms are implemented in the open-source software package SymmHub, designed as a platform for experimentation and research in geometry.
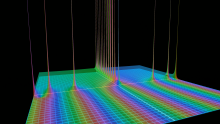
We’ll start from a very straightforward visual of the Riemann Zeta function as a sum, and proceed to alternate ways to interpret it so that we can make sense of it in the region of divergence. From there, we can play around with how it interplays with the sum over (1/k)(1/p^{ks}) on those same spots, where zeta zeros look like poles.

I give many outreach lectures to undergraduates explaining my research in knot theory and braid group representation theory. I will show the illustrating math community how I use Math-Dance videos in my outreach lectures.
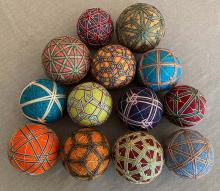
Drawing from the speaker’s work as well as the work of many other mathematical artists, particularly fiber artists, we will discuss the relationship between choice of medium and illustration of mathematical concepts.
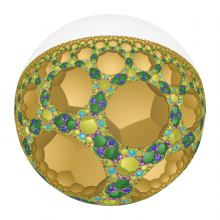
The Dodecahedron is to the 120-Cell as the Klein Quartic is to the 350-Cell. The latter two are examples of "abstract regular polytopes." I'm going to share adventures trying to grasp understanding of these abstract objects, an asymptotic journey. I'll muse about how illustration helps us get past walls of personal understanding, and allows us to connect with each other for sharing abstract ideas. Solidarity!

Untangling unknots has been a fun pastime since at least the Victorian era. (And there are some great phone games as well, now!) But now AI can play, and it turns out to be surprisingly bad at the game. In this talk, we talk about some ways to look at knot and unknot puzzles mathematically and computationally and talk about why you might seriously want to solve a lot of them in a short period of time. The key turns out to be new and interesting ways to find and visualize moves that you can make on the diagrams.
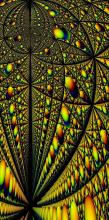
For several years I ran a blog called Visual Insight, which was a place to share striking images that help explain topics in mathematics. In this talk I'd like to show you some of those images and explain some of the mathematics they illustrate.
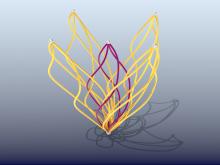
We develop the idea that we can learn about special relativity, not through physics, but through a relativistic dot product. It's the ordinary dot product, but with a minus sign stuck in front of the final term. What difference could that make? You will see nonzero vectors of length zero, events that are both before and after other events, depending on who is asking, and even the twin paradox, where two travelers start and end at the same coordinates in spacetime, but one is actually older. We illustrate all this with mathematical art, as in the attached image. The pearls at the ends of curves are places where various travelers could arrive in spacetime, having traveled paths that are indistinguishable in any physical way!